html tool

显示标签为“sar”的博文。显示所有博文

2021年9月28日星期二

转:sar 时间格式设置

 https://blog.csdn.net/signmem/article/details/12194871

默认状态 SAR 以中文进行输出


export LANG=en_US 执行后, 输出效果如下


06:00:01 PM     CPU     %user     %nice   %system   %iowait    %steal     %idle

06:10:01 PM     all      0.26      0.00      0.09      0.00      0.00     99.65

06:20:01 PM     all      0.28      0.00      0.09      0.00      0.00     99.63

06:30:01 PM     all      0.25      0.00      0.09      0.00      0.00     99.65


但时间变成 AM, PM 格式了


export LC_TIME="POSIX" 执行后, 输出会自动取消 AM/PM 格式, 默认变回 24 小时格式制


23:20:01    CPU     %user     %nice   %system   %iowait    %steal     %idle

23:20:01    all      0.26      0.00      0.09      0.00      0.00     99.65

23:30:01    all      0.27      0.00      0.10      0.00      0.00     99.63

23:40:01    all      0.25      0.00      0.10      0.00      0.00     99.65


2018年5月7日星期一

sar 内存


https://blog.csdn.net/u012167045/article/details/55056940

5. sar 内存和交换空间监控
这里写图片描述
Kbmemfree:这个值和free命令中的free值基本一致,所以它不包括buffer和cache的空间。
kbmemused:这个值和free命令中的used值基本一致,所以它包括buffer和cache的空间。
%memused:这个值是kbmemused和内存总量(不包括swap)的一个百分比。
kbbuffers和kbcached:这两个值就是free命令中的buffer和cache。
kbcommit:保证当前系统所需要的内存,即为了确保不溢出而需要的内存(RAM+swap)。
%commit:这个值是kbcommit与内存总量(包括swap)的一个百分比。
6 . sar 内存分页监控
这里写图片描述
pgpgin/s:表示每秒从磁盘或SWAP置换到内存的字节数(KB)。
pgpgout/s:表示每秒从内存置换到磁盘或SWAP的字节数(KB)。
fault/s:每秒钟系统产生的缺页数,即主缺页与次缺页之和(major + minor)。
majflt/s:每秒钟产生的主缺页数。

[popexizhi]
例子--es大量的swapping 主机的sar -B

2018年1月17日星期三

sar历史日志

参考:
http://blog.csdn.net/panda_bear/article/details/8005102
http://haibing.org/?p=90

"sar -参数 -f filename",可以查看二进制文件,通过选择查看参数;
    参数解释如下:
    -A    所有报告的总和
    -u    CPU利用率
    -v    进程、I节点、文件和锁表状态
    -d    硬盘使用报告
    -r    没有使用的内存页面和硬盘块
    -g    串口I/O的情况
    -b    缓冲区使用情况
    -a    文件读写情况
    -c    系统调用情况
    -R    进程的活动情况
    -y    终端设计活动情况
    -w    系统交换活动 
 
    补充说明:
    "sar -参数 -o filename 间隔时间 采集次数"
    可以根据需要的性能参数,手动开启性能数据采集记录入文件;
    "sar -f filename"
    通过以上指令对二进制文件进行查看。

查看日志文件 ------------------------
日志文件是二进制的,直接打开没办法看。
为sar命令指定-f以选择要读取的文件。如果想读1日的数据,可以使用命令sar -f /var/log/sa/sa01来读取sa01以查看当天的数据,这里会打开当天全部的数据,基本上没办法看。
我们通常都是想看某一时段的数据,这时就需要添加开始时间和结束时间:
使用-s和-e参数(即开始和结束)来指定具体时间以缩小查询的范围。
请注意,-s并不是包含性的,所以必须从所选择的开始时间中多减去十分钟。
1
2
3
4
5
6
7
8
9
10
11
[root@linux sa]# sar -f  sa01 -s 01:00:00 -e 05:00:00 -u
sar -f 日志文件  -s 开始时间  -e 结束时间 平时我们经常用的参数
Usage: sar [ options... ] [ [ <count> ] ]
Options are:
[ -A ] [ -b ] [ -B ] [ -c ] [ -d ] [ -i ] [ -p ] [ -q ]
[ -r ] [ -R ] [ -t ] [ -u ] [ -v ] [ -V ] [ -w ] [ -W ] [ -y ]
[ -I { | SUM | ALL | XALL } ] [ -P { | ALL } ]
[ -n { DEV | EDEV | NFS | NFSD | SOCK | ALL } ]
[ -x { | SELF | ALL } ] [ -X { | SELF | ALL } ]
[ -o [ ] | -f [ ] ]
[ -s [ ] ] [ -e [ ] ]
再来总结一下:
sa1 是调用sadc将性能数据收集到二进制日志文件中的一个Shell 脚本,而且在cron中被计划执行,每隔十分钟运行一次;
sa2 是将当日二进制日志文件中所有的数据转储到文本文件,并根据保存天数清除过期日志文件的一个shell脚本,在cron中每晚23:53分定期执行;
sadc 是系统动态数据收集工具,收集的数据被写一个二进制的文件中,也是其中最重要的工具,其它工具基本上都是调用它来实现功能;
sadf 显示被sar通过多种格式收集的数据;


安装sysstat-------------------------------------
安装这么简单的事就不讲了
1
2
#sar -V 查看一下版本
sysstat version 7.0.2
sar其实是sysstat中的其中一个工具。
Sysstat 是一个软件包,包含监测系统性能及效率的一组工具,这些工具对于我们收集系统性能数据,比如CPU使用率、硬盘和网络吞吐数据,这些数据的收集和分析,有利于我们判断系统是否正常运行,是提高系统运行效率、安全运行服务器的得力助手。

Sysstat 软件包集成如下工具:

Sysstat的功能列表:
◆iostat:统计并报告你的设备的CPU状态和I/O状态数据。
◆mpstat:监控和显示关于CPU的细节信息。
◆pidstat:统计正在运行的进程/任务的CPU、内存等信息。
◆sar:保存和报告不同资源(CPU、内存、输入输出、网络、内核等)的详细信息。
◆sadc:系统活动数据收集器,用于为sar收集后台的数据。
◆sa1:读取和存储sadc的数据文件的二进制数据。
◆sa2:和sar协作,用于总结每日报告。
◆Sadf:以不同的格式(CSV或XML)显示sar生成的数据。
◆Sysstat:解释sysstat的各种作用。
◆nfsiostat-sysstat:统计NFS协议的网络文件系统的 I/O状态数据。
◆cifsiostat:统计CIFS协议的网络文件系统的 I/O状态数据。
安装完,sysstat默认就是随机启动的。
可以通过chkconfig –list|grep sysstat来检查
而且会在日志保存目录/var/log/sa/中产生当天的日志文件:这也说明sysstat运行正常。
1
2
3
cd /var/log/sa/
ls
sa01 sa02 sar01

2017年4月20日星期四

转载: sar 如何开启


add:https://www.blackmoreops.com/2014/06/18/sysstat-sar-examples-usage/


sysstat – SAR examples and usage

This first part describes SAR examples and usage along with installation.

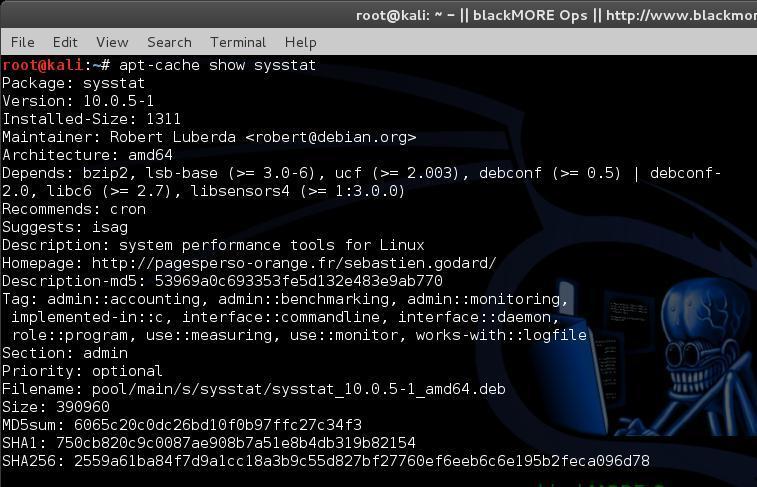
Step 1. Install sysstat Package

sysstat is usually not installed in Linux system by default. You need to install it. You also need to make sure you have the correct repositories added. As I personally use Kali Linux, I’ve added Kali Linux official repositories. Follow your distro documentation to add yours. But it is pretty straight forward.
How to use sar for monitoring - sysstat sar examples and usage - blackMORE Ops - 1
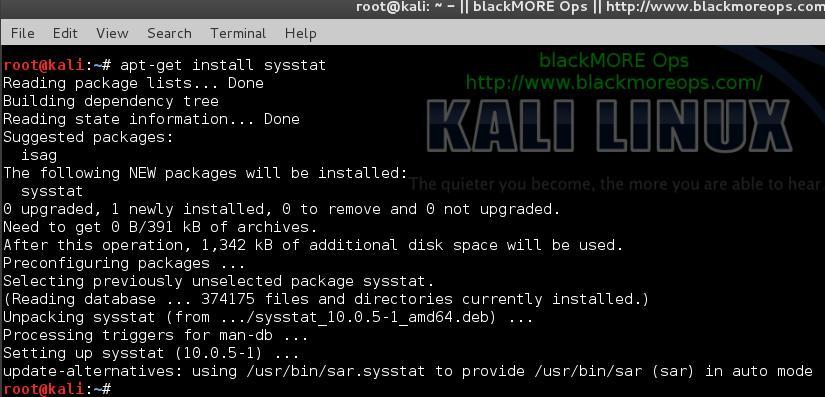
To install sysstat package:
sudo apt-get install sysstat
(or)
yum install sysstat
(or)
rpm -ivh sysstat-10.0.0-1.i586.rpm
How to use sar for monitoring - sysstat sar examples and usage - blackMORE Ops - 2

Step 2. Enable stat collection

In new systems once you’ve installed sysstat, it enables statistics collections by default. In case it is not you can enable it by editing 1 word in the following file:
vi /etc/default/sysstat
Change ENABLED=”false” to ENABLED=”true”
#
# Default settings for /etc/init.d/sysstat, /etc/cron.d/sysstat
# and /etc/cron.daily/sysstat files
#

# Should sadc collect system activity informations? Valid values
# are "true" and "false". Please do not put other values, they
# will be overwritten by debconf!
ENABLED="true"
Save the file. Restart sysstat.
service sysstat restart
(or)
/etc/init.d/sysstat restart
Once it’s restarted, it will start collecting data.

Step 3. Changing collection intervals

Default sysstat configuration collects data every 10 minutes. You can change it easily. If you got a fast system or you need more intensive monitoring of your system (i.e. a web server with enough RAM and Processor), then you might want to reduce the collection interval from 10 minutes to 2 minutes. Alternatively, you can change it to 15 minutes if you got a slow system. Either way, it’s easy to do and here are the steps:
vi /etc/cron.d/sysstat
# The first element of the path is a directory where the debian-sa1
# script is located
PATH=/usr/lib/sysstat:/usr/sbin:/usr/sbin:/usr/bin:/sbin:/bin

# Activity reports every 10 minutes everyday
5-55/10 * * * * root command -v debian-sa1 > /dev/null && debian-sa1 1 1

# Additional run at 23:59 to rotate the statistics file
59 23 * * * root command -v debian-sa1 > /dev/null && debian-sa1 60 2
Change
5-55/10 * * * * root command -v debian-sa1 > /dev/null && debian-sa1 1 1
To
*/2 * * * * root command -v debian-sa1 > /dev/null && debian-sa1 1 1
Save the file and restart sysstat.
service sysstat restart
(or)
/etc/init.d/sysstat restart

Step 4. Check sysstat version

Once installed, verify the sar version using the following command:
root@kali:~# sar -V
sysstat version 10.0.5
(C) Sebastien Godard (sysstat  orange.fr)